Analytics Feature Description
Feature description and testing guide for the analytics and reporting module with 18 features
1. What Is the Analytics & Reporting System?
The Analytics & Reporting system tracks, measures, and visualizes how readers interact with the Hyphen publishing platform. It combines two data sources:
-
Google Analytics 4 (GA4) — Tracks real-time reader behavior on the Reader Portal: page views, scroll depth, article reading time, paywall interactions, device types, geographic data, and traffic sources.
-
Internal Platform Data (PostgreSQL/Prisma) — Tracks subscription metrics, revenue, reader registrations, institutional usage, content moderation, and social media performance from the platform's own database.
Together, these provide a complete picture across the entire reader lifecycle: from first visit to content consumption to subscription conversion to long-term retention.
2. Business Objectives & KPIs
Primary KPIs Tracked
| KPI Category | Metrics | Data Source | Update Frequency |
|---|---|---|---|
| Traffic | Page Views, Unique Visitors, Sessions, Avg. Session Duration, Bounce Rate | GA4 | Near real-time |
| Content Engagement | Scroll Depth (25/50/75/100%), Read Completion Rate, Avg. Time on Article, Top Articles | GA4 | Near real-time |
| Subscription Health | Total Subscribers, New Subscribers, Churn Rate, MRR, ARR, ARPU, LTV | Prisma DB | Real-time |
| Revenue | Monthly Recurring Revenue, Annual Recurring Revenue, Revenue by Plan, Growth Rate | Prisma DB (Payment table) | Real-time |
| Conversion | Paywall View Rate, Paywall Click-Through Rate, Subscribe Start Rate, Subscribe Completion Rate | GA4 (custom events) | Near real-time |
| Registration | Visitor-to-Registration Rate, Email Verification Rate, Registration-to-Subscription Rate | GA4 + Prisma | Mixed |
| Audience | Desktop/Mobile/Tablet Split, Browser Distribution, Top Countries, Traffic Sources (Organic/Direct/Social/Referral/Email/Paid) | GA4 | Near real-time |
| Institutional | Seat Utilization Rate, Active Users per Institution, Content Access Patterns | Prisma DB | Real-time |
| Social Media | Impressions, Reach, Engagement Rate, Follower Growth, Best Posting Times | Platform APIs (Meta, X) | Periodic sync |
| E-Commerce | Product Views, Add-to-Cart Rate, Checkout Start Rate | GA4 (custom events) | Near real-time |
| Newsletter | Newsletter Views, Scroll Depth, Read Completion, Share Rate | GA4 (custom events) | Near real-time |
Business Questions the System Answers
| Question | Where to Find the Answer |
|---|---|
| "How many people are reading our content?" | Analytics Overview > Key Metrics Cards (Page Views, Unique Visitors) |
| "Which articles are most popular?" | Analytics Overview > Top Content section |
| "How are subscriptions growing?" | Analytics Overview > Subscription Metrics (MRR, New Subscribers, Churn) |
| "Where is our traffic coming from?" | Analytics Overview > Traffic Sources (Organic, Direct, Social, etc.) |
| "How well is the paywall converting?" | Analytics Overview > Paywall Funnel (view -> click -> start -> complete) |
| "What devices do our readers use?" | Analytics Overview > Device Breakdown (Desktop/Mobile/Tablet) |
| "Are institutional subscribers using their access?" | Analytics > Institutional Usage Reports |
| "How are our social posts performing?" | Social > Analytics (Impressions, Engagement, Best Times) |
| "How deep are readers reading articles?" | Analytics Overview > Scroll Depth (25/50/75/100% distribution) |
| "Which marketing channels drive the most conversions?" | GA4 > Acquisition > UTM attribution from conversion surfaces |
3. System Architecture — Where Data Comes From
Reader Portal (Next.js)                      Admin Console (Next.js)
+---------------------------+                +---------------------------+
|                           |                |                           |
|  GoogleAnalytics.tsx      |   GA4 Data     |  Analytics Page           |
|  (gtag.js script)   -----+---API---------->  /api/analytics/*         |
|                           |                |  (ga4-data-client.ts)     |
|  analytics.ts             |                |                           |
|  (custom events)          |   Custom       |  Dashboard Page            |
|  - paywall_view           |   Events       |  /api/stats/dashboard     |
|  - article_scroll_depth   |                |                           |
|  - subscribe_start        |                |  /api/analytics/          |
|  - shop_add_to_cart       |                |   - traffic-sources       |
|  - conversion_surface_*   |                |   - content-performance   |
|  - newsletter_*           |                |   - subscription-metrics  |
|  etc.                     |                |   - paywall-funnel        |
|                           |                |   - registration-funnel   |
|  CookieConsent.tsx        |                |   - device-browser        |
|  (consent gating)         |   Prisma       |   - institutional-usage   |
|                           |   DB Data      |   - author-stats          |
|  ReadingTracker.tsx       +---API---------->   - export                |
|  (progress to backend)    |                |                           |
|                           |                |  /api/stats/subscribers   |
+---------------------------+                +---------------------------+
         |                                              |
         v                                              v
   Google Analytics 4                          PostgreSQL Database
   (GA4 Property)                              (Prisma Models)
   - pageview events                           - Subscription
   - custom events                             - Payment
   - real-time data                            - Reader
   - audience data                             - ReadingHistory
   - acquisition data                          - Institution
                                               - InstitutionUser
                                               - Comment
                                               - ArticleRating
                                               - ConversionEvent
Data Source Mapping
| Data Point | Source | How It Gets There |
|---|---|---|
| Page views | GA4 | Automatic — gtag.js fires page_view on every navigation |
| Unique visitors | GA4 | Automatic — GA4 deduplicates by client ID |
| Article scroll depth | GA4 | Custom event — observeScrollDepth() in article templates fires at 25/50/75/100% |
| Article read complete | GA4 | Custom event — fires when reader scrolls to 100% |
| Paywall views | GA4 | Custom event — trackPaywallView() fires when PaywallOverlay renders |
| Subscribe button clicks | GA4 | Custom event — trackPaywallClickSubscribe() fires on paywall CTA click |
| Subscription start | GA4 | Custom event — trackSubscribeStart() fires when reader begins checkout |
| Subscription complete | GA4 | Custom event — trackSubscribeComplete() fires after payment verification |
| Product views | GA4 | Custom event — trackProductView() fires on shop product page |
| Add to cart | GA4 | Custom event — trackAddToCart() fires on "Add to Cart" button click |
| Newsletter scroll depth | GA4 | Custom event — observeNewsletterScrollDepth() fires at 25/50/75/100% |
| Conversion surface interactions | GA4 + Internal | Dual tracked — GA4 events + ConversionEvent table |
| MRR / ARR / Revenue | Prisma DB | Calculated from Payment + Subscription tables |
| Subscriber counts | Prisma DB | COUNT queries on Subscription table |
| Churn rate | Prisma DB | Cancelled subscriptions / total subscriptions |
| Institutional usage | Prisma DB | InstitutionUser activity data |
| Reading history | Prisma DB | ReadingTracker component POSTs progress data to admin API |
| Traffic sources | GA4 Data API | Server-side query via ga4-data-client.ts |
| Device breakdown | GA4 Data API | Server-side query for deviceCategory dimension |
4. GA4 Event Catalog — Every Event the Platform Fires
4.1 Automatic Events (fired by gtag.js)
| Event | When Fired | Parameters |
|---|---|---|
page_view | Every page navigation | page_path, page_title |
4.2 Article Engagement Events
| Event | When Fired | Parameters | Trigger Location | Status |
|---|---|---|---|---|
article_view | Reader opens an article page | article_slug, article_section, content_type | Article page templates | Pending wiring |
article_scroll_depth | Reader scrolls past 25%, 50%, 75%, or 100% of article | article_slug, article_section, scroll_depth (25/50/75/100) | observeScrollDepth() in article templates | Wired |
article_read_complete | Reader scrolls to 100% of article | article_slug, read_time_seconds | observeScrollDepth() at 100% milestone | Wired |
4.3 Paywall Events
| Event | When Fired | Parameters | Trigger Location | Status |
|---|---|---|---|---|
paywall_view | PaywallOverlay or paywall gate renders on screen | article_slug, article_section | PaywallOverlay, ArticlePaywallGate components | Pending wiring |
paywall_click_subscribe | Reader clicks "Subscribe" on a paywall | article_slug | PaywallOverlay CTA click handler | Pending wiring |
4.4 Subscription Events
| Event | When Fired | Parameters | Trigger Location | Status |
|---|---|---|---|---|
subscribe_start | Reader begins subscription checkout | plan_name, plan_price | Checkout page on mount | Pending wiring |
subscribe_complete | Payment verified and subscription activated | plan_name, payment_method | After payment verification success | Pending wiring |
4.5 E-Commerce / Shop Events
| Event | When Fired | Parameters | Trigger Location | Status |
|---|---|---|---|---|
shop_product_view | Reader opens a product detail page | product_handle, product_name, price | Shop product page | Pending wiring |
shop_add_to_cart | Reader clicks "Add to Cart" | product_handle, product_name, price, quantity | CartProvider addItem handler | Pending wiring |
shop_checkout_start | Reader clicks "Checkout" in cart | cart_value, item_count | Cart checkout redirect | Pending wiring |
4.6 Conversion Surface Events
| Event | When Fired | Parameters | Trigger Location |
|---|---|---|---|
conversion_surface_impression | Conversion surface is displayed to reader | surface_id, surface_name, surface_type, conversion_goal, page_url | ConversionSurfaceRenderer on trigger |
conversion_surface_click | Reader clicks surface CTA | surface_id, surface_name, surface_type, conversion_goal, cta_type | ConversionSurfaceProvider trackClick |
conversion_surface_dismiss | Reader dismisses surface | surface_id, surface_name, surface_type, conversion_goal | ConversionSurfaceProvider dismissSurface |
conversion_surface_conversion | Reader completes desired action | surface_id, surface_name, conversion_goal, conversion_type | ConversionSurfaceProvider trackConversion |
coupon_copied | Reader copies a coupon code | surface_id, coupon_code, discount_percent, discount_amount | Surface component copy handler |
4.7 Newsletter Events
| Event | When Fired | Parameters | Trigger Location |
|---|---|---|---|
newsletter_view | Reader opens a newsletter edition page | newsletter_slug, edition_number, topic | Newsletter edition page |
newsletter_scroll_depth | Reader scrolls newsletter at 25/50/75/100% | newsletter_slug, scroll_depth | observeNewsletterScrollDepth() |
newsletter_read_complete | Reader reaches 100% of newsletter | newsletter_slug, read_time_seconds | At 100% milestone |
newsletter_share | Reader shares a newsletter | newsletter_slug, platform | SocialShare on newsletter page |
newsletter_list_view | Reader views newsletter archive list | topic | Newsletter listing page |
newsletter_signup | Reader subscribes to newsletter | source, surface_id | Newsletter form submit |
4.8 Registration Events
| Event | When Fired | Parameters | Trigger Location | Status |
|---|---|---|---|---|
registration_start | Reader begins registration flow | source, surface_id | Registration page or conversion surface CTA | Pending wiring |
Event Flow Summary
Reader Journey:
  Visit site -----> page_view (automatic)
  Browse article -> article_view
  Scroll reading -> article_scroll_depth (25%, 50%, 75%)
  Finish article -> article_scroll_depth (100%) + article_read_complete
  Hit paywall ----> paywall_view
  Click Subscribe > paywall_click_subscribe
  Start checkout -> subscribe_start
  Complete payment> subscribe_complete

  Browse shop ----> shop_product_view
  Add to cart ----> shop_add_to_cart
  Checkout -------> shop_checkout_start

  See promo modal > conversion_surface_impression
  Click CTA ------> conversion_surface_click
  Copy coupon ----> coupon_copied
  Complete action > conversion_surface_conversion
5. Admin Dashboard — Quick Daily Snapshot
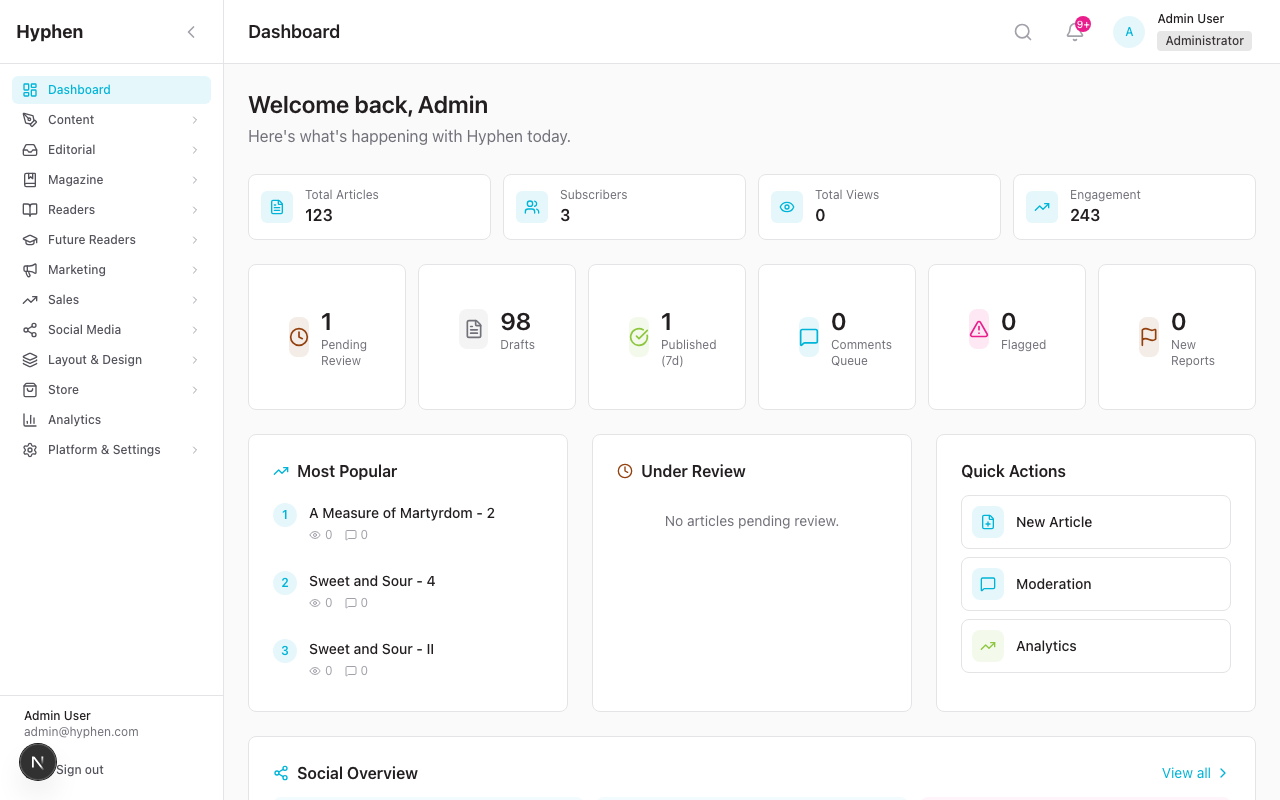
Location
Admin Console > Dashboard (landing page after login)
What It Shows
4 Primary Stat Cards:
| Card | Source | Description |
|---|---|---|
| Total Articles | Prisma DB | All articles across all statuses |
| Subscribers | Prisma DB | Active subscriber count + "+X this month" |
| Total Views | Prisma DB / GA4 | Total article view count |
| Engagement | Prisma DB | Comments + shares combined |
6 Status Cards:
| Card | Source | Clickable? |
|---|---|---|
| Pending Review | Prisma DB (Article.status = pending_review) | Yes -- opens filtered content page |
| Drafts | Prisma DB (Article.status = draft) | Yes -- opens filtered content page |
| Published (7d) | Prisma DB | No |
| Comments Queue | Prisma DB (Comment.status = pending) | Yes -- opens moderation page |
| Flagged | Prisma DB (Comment.status = flagged) | Yes -- opens moderation page |
| New Reports | Prisma DB (ContentReport.status = open) | Yes -- opens moderation page |
3-Column Section:
- Most Popular articles (by view count)
- Under Review articles (pending editorial review)
- Quick Actions (New Article, Moderation, Analytics)
Social Overview Widget:
- Scheduled Today / This Week / Failed post counts
- Quick links to Compose Post and Social Analytics
Recently Published:
- Last 6 published articles with views, comments, shares
6. Analytics Overview Page — Deep Metrics
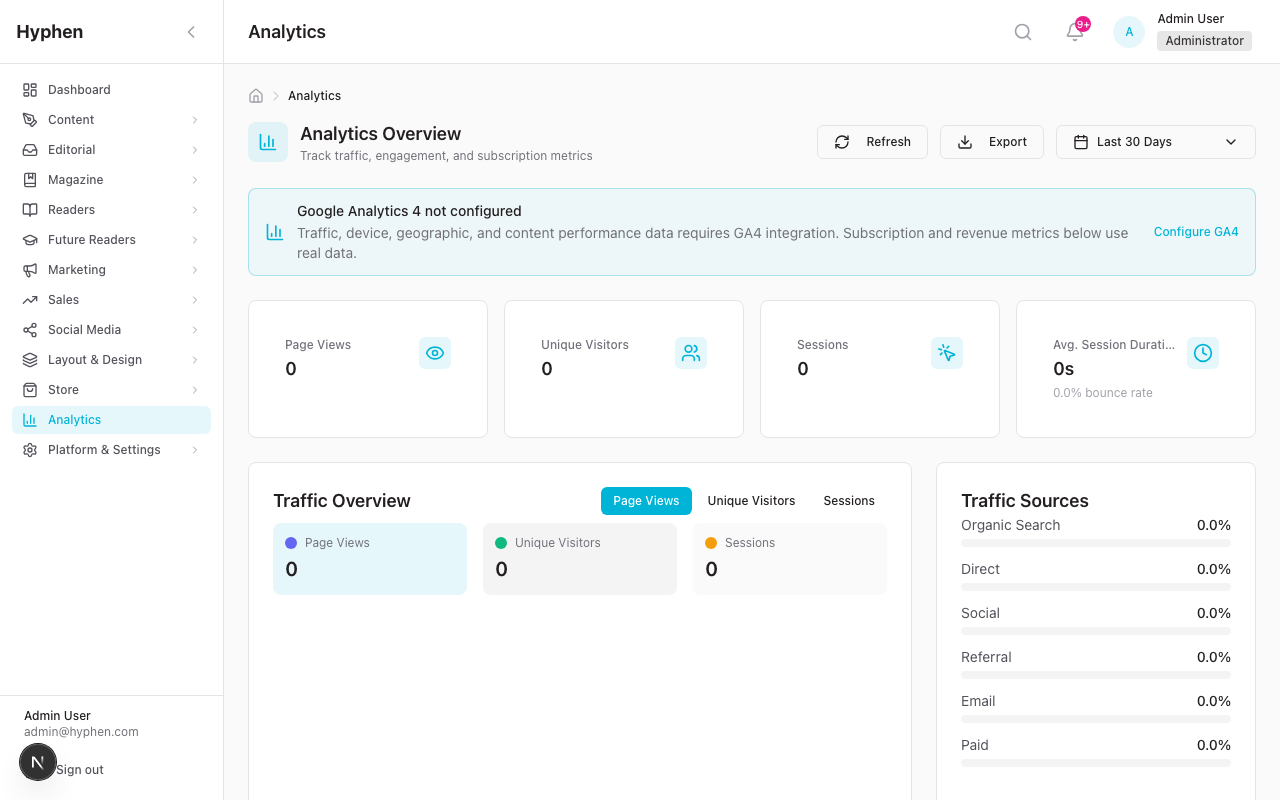
Location
Admin Console > Analytics
Controls
- Date Range Picker: 7d, 30d (default), 90d, 12m, Custom
- Refresh Button: Reloads all data
- Export Button: Downloads CSV report (requires ANALYTICS_EXPORT permission)
Section Layout
| Section | Position | Data Source | Description |
|---|---|---|---|
| Key Metrics Cards | Top row | GA4 | Page Views, Unique Visitors, Sessions, Avg. Session Duration -- each with % change vs previous period |
| Traffic Chart | Left 2/3 | GA4 | Time-series line chart with toggleable lines (Page Views, Unique Visitors, Sessions) |
| Traffic Sources | Right 1/3 | GA4 | Channel breakdown bars (Organic, Direct, Social, Referral, Email, Paid) |
| Subscription Metrics | Left half | Prisma | Total Subscribers, New Subscribers, Churn Rate, MRR, plan breakdown, subscriber trend sparkline, Conversion Rate, ARPU, LTV |
| Top Content | Right half | GA4 | Table: Rank, Title, Page Views, Time on Page, Shares, Comments |
| Paywall Conversion Funnel | Left half | GA4 | 4-stage funnel: Paywall Viewed -> Clicked Subscribe -> Subscription Started -> Subscription Completed |
| Scroll Depth Distribution | Right half | GA4 | Estimated distribution at 25%, 50%, 75%, 100% thresholds |
| Device Breakdown | Left 1/3 | GA4 | Desktop / Mobile / Tablet percentages |
| Top Countries | Right 1/3 | GA4 | Top 5 countries with flag icons and percentage |
| GA4 Link Banner | Bottom | -- | "Need more detailed analytics?" link to Google Analytics |
7. Paywall Conversion Funnel
What It Tracks
The paywall funnel measures the step-by-step conversion journey from seeing a paywall to completing a paid subscription.
| Stage | GA4 Event | Description | Example Count |
|---|---|---|---|
| Paywall Viewed | paywall_view | Reader saw a paywall overlay or gate | 10,000 |
| Clicked Subscribe | paywall_click_subscribe | Reader clicked the "Subscribe" CTA on a paywall | 2,500 (25% of stage 1) |
| Subscription Started | subscribe_start | Reader began the checkout process | 1,200 (12% of stage 1) |
| Subscription Completed | subscribe_complete | Reader completed payment and subscription activated | 450 (4.5% of stage 1) |
How to Read the Funnel
- The conversion rate shown at each stage is relative to the top of the funnel (stage 1)
- A healthy paywall funnel converts 2-5% of paywall views to completed subscriptions
- Large drop-offs between stages indicate friction points:
- Big drop between "Viewed" and "Clicked Subscribe" = paywall messaging isn't compelling
- Big drop between "Started" and "Completed" = checkout friction (price, payment method, UX)
Data Source
GA4 Data API -- server-side query aggregating custom event counts over the selected date range.
8. Registration Funnel
What It Tracks
The registration funnel measures how effectively the platform converts anonymous visitors to active subscribers.
| Stage | Data Source | Description |
|---|---|---|
| Total Visitors | GA4 | Unique visitors in the period |
| Registered | Prisma DB | Readers who created an account |
| Verified | Prisma DB | Readers who verified their email |
| Active Subscribers | Prisma DB | Readers with active paid subscriptions |
API Endpoint
GET /api/analytics/registration-funnel?days=30
9. Subscription & Revenue Metrics
Metrics Displayed
| Metric | Definition | Source |
|---|---|---|
| Total Subscribers | Active + recently cancelled subscribers | Prisma: Subscription table |
| Active Subscribers | Currently paying subscribers | Prisma: Subscription.status = ACTIVE |
| New Subscribers | Subscriptions created in the current month | Prisma: Subscription.createdAt within month |
| Cancelled Subscribers | Subscriptions cancelled in the period | Prisma: Subscription.status = CANCELED |
| Churn Rate | (Cancelled / Total) as percentage | Calculated |
| MRR (Monthly Recurring Revenue) | Sum of monthly subscription payments | Prisma: Payment table aggregation |
| ARR (Annual Recurring Revenue) | MRR x 12 | Calculated |
| ARPU (Avg Revenue Per User) | MRR / Active Subscribers | Calculated |
| LTV (Lifetime Value) | ARPU / Monthly Churn Rate | Calculated (estimated) |
| Conversion Rate | Trial-to-paid conversion percentage | Prisma: Subscription.status transitions |
Revenue by Plan Breakdown
Shows subscriber distribution and revenue contribution per plan (e.g., "Digital Only: 45%, Print+Digital: 30%, Annual: 25%").
Revenue Trend
Monthly time-series chart of revenue, showing growth trajectory.
API Endpoint
GET /api/analytics/subscription-metrics
10. Content Performance Analytics
Metrics Per Article
| Metric | Source | Description |
|---|---|---|
| Page Views | GA4 | Total times the article was loaded |
| Active Users | GA4 | Unique readers who viewed the article |
| Avg. Engagement Time | GA4 | Average time spent reading |
| Scroll Depth | GA4 | Distribution at 25/50/75/100% thresholds |
Top Content Table
Ranked list showing the highest-performing articles by page views, with time-on-page, shares, and comments.
Author Statistics
GET /api/analytics/author-stats — Per-author metrics for editorial performance review.
API Endpoint
GET /api/analytics/content-performance
11. Traffic Source Analysis
Channels Tracked
| Channel | How It's Identified | Example |
|---|---|---|
| Organic Search | Visitors from search engines (Google, Bing) | google / organic |
| Direct | Visitors who typed URL or used bookmark | (direct) / (none) |
| Social | Visitors from social media links | facebook / social, twitter / social |
| Referral | Visitors from other websites linking to you | blog.example.com / referral |
| Visitors from email links (UTM tagged) | newsletter / email | |
| Paid | Visitors from paid advertising | google / cpc, facebook / paid |
UTM Attribution from Conversion Surfaces
When readers click a conversion surface CTA, the URL is automatically tagged with:
utm_source=conversion_surfaceutm_medium=promoutm_campaign=cs_{goal}_{surfaceId}
This appears in GA4 traffic source reports, allowing you to measure the direct impact of conversion surfaces on subscriptions.
API Endpoint
GET /api/analytics/traffic-sources
12. Device & Browser Analytics
Device Categories
- Desktop (screen > 1024px)
- Mobile (screen < 768px)
- Tablet (768-1024px)
Browser Distribution
Top browsers by usage (Chrome, Safari, Firefox, Edge, etc.)
Operating Systems
Distribution across Windows, macOS, iOS, Android, Linux.
API Endpoint
GET /api/analytics/device-browser
13. Institutional Usage Reporting
What It Tracks
For each institution with an active subscription:
| Metric | Description |
|---|---|
| Seats Used / Total | How many assigned seats are actively logging in |
| Utilization Rate | (Active users / Total seats) as percentage |
| Active Users | Users who logged in during the period |
| Content Accessed | Number of articles/issues accessed |
Use Case
Sales and customer success teams use this data to:
- Identify underutilized institutional accounts for engagement outreach
- Prepare usage reports for institutional renewal conversations
- Upsell additional seats to institutions with high utilization
API Endpoint
GET /api/analytics/institutional-usage
14. Social Media Analytics
Location
Admin Console > Social > Analytics
Tabs
- Performance -- Impressions, Reach, Engagements, Engagement Rate, Posts Published, Likes, Comments, Clicks
- Content -- Per-post performance breakdown
- Growth -- Follower growth trends
- Best Times -- Optimal posting time recommendations based on engagement data
- Executive -- Summary view for leadership (requires SOCIAL_EXECUTIVE_READ permission)
Metrics
| Metric | Description |
|---|---|
| Total Impressions | Times posts were displayed |
| Total Reach | Unique people who saw posts |
| Total Engagements | Likes + comments + shares + clicks |
| Avg. Engagement Rate | Engagements / Impressions |
| Posts Published | Number of posts in the period |
| Follower Growth | Net new followers |
15. Data Export & Reporting
Export Formats
- CSV -- Comma-separated values for spreadsheet analysis
- JSON -- Machine-readable format for programmatic use
Available Exports
| Export | Contents |
|---|---|
| Traffic | Page views, visitors, sessions by date |
| Subscriptions | Subscriber counts, MRR, churn by month |
| Revenue | Revenue by month and by plan |
| Content | Top articles with page views, engagement time |
How to Export
- Navigate to Analytics page
- Set the desired date range
- Click the Export button (top-right)
- CSV file downloads automatically
Permission Required
ANALYTICS_EXPORT permission
API Endpoint
GET /api/analytics/export?type=subscriptions&format=csv&days=30
16. Cookie Consent & Privacy
How It Works
- GoogleAnalytics component loads with
analytics_storage: deniedby default - CookieConsent component shows a banner asking the reader to accept cookies
- If reader accepts, consent is stored in
localStorageashyphen_cookie_consent: accepted - On subsequent visits,
analytics_storageis set tograntedbased on stored consent - If reader does not accept, GA4 events are still queued but not sent to Google
Impact on Analytics
- Readers who decline cookies will NOT generate GA4 data
- This means page views, scroll depth, and all custom events from those readers are invisible
- Internal platform data (subscriptions, reading history, bookmarks) is NOT affected by cookie consent -- it's recorded via authenticated API calls
Privacy Compliance
- Cookie consent follows GDPR principles
- No tracking cookies set before consent
- Consent status persisted only in
localStorage(not server-side)
17. Scroll Depth & Reading Engagement Tracking
How Scroll Tracking Works
The observeScrollDepth() function in the Reader Portal:
- Attaches a passive scroll event listener when an article page mounts
- Calculates scroll percentage:
(window.scrollY / (scrollHeight - windowHeight)) * 100 - Fires
article_scroll_depthat each milestone (25%, 50%, 75%, 100%) - Each milestone fires exactly once per page load
- At 100%, also fires
article_read_completewith total read time in seconds
What the Admin Sees
In the Analytics Overview page, the Scroll Depth Distribution section shows estimated percentages:
- % of readers who scrolled to 25%
- % of readers who scrolled to 50%
- % of readers who scrolled to 75%
- % of readers who scrolled to 100% (completed reading)
Reading Progress (Internal Tracking)
Separately from GA4, the ReadingTracker component:
- POSTs reading progress to
/api/account/history/[articleId]at milestones (0/25/50/75/100%) - Tracks
progress,scrollPosition,timeSpentSec - Records
startedAt,lastReadAt,completedAtin the ReadingHistory table - This powers the reader's Reading History page and the Implicit Preference Learning system
18. Conversion Surface Analytics
See the dedicated Conversion Surfaces Feature Description for full details.
Summary of analytics integration:
- 5 GA4 events: impression, click, dismiss, conversion, coupon_copied
- Internal ConversionEvent table: every interaction recorded with reader context
- Denormalized counters on each surface: impressionCount, clickCount, dismissCount, conversionCount
- Admin stats dashboard: totals, rates, time-series, device breakdown, top pages, UTM source breakdown
- UTM attribution: all CTA URLs auto-tagged for GA4 campaign tracking
19. User Stories
For Editors
| ID | As a... | I want to... | So that... |
|---|---|---|---|
| US-01 | Editor | See which articles are most read this week | I can commission similar content |
| US-02 | Editor | Know what percentage of readers finish articles | I can assess if article length is appropriate |
| US-03 | Editor | See which sections have the most traffic | I can allocate editorial resources accordingly |
For Product Managers
| ID | As a... | I want to... | So that... |
|---|---|---|---|
| US-04 | Product Manager | Track the paywall conversion funnel end-to-end | I can identify and fix friction points |
| US-05 | Product Manager | Monitor MRR and subscriber growth monthly | I can report business health to stakeholders |
| US-06 | Product Manager | See the registration-to-subscription conversion rate | I can measure the effectiveness of the onboarding flow |
| US-07 | Product Manager | Compare traffic between date ranges | I can measure the impact of marketing campaigns |
For Marketing
| ID | As a... | I want to... | So that... |
|---|---|---|---|
| US-08 | Marketing Manager | See which traffic sources drive the most subscribers | I can allocate budget to the best channels |
| US-09 | Marketing Manager | Track conversion surface performance (impressions, clicks, conversions) | I can optimize promotional overlays |
| US-10 | Marketing Manager | Know what percentage of traffic comes from social media | I can justify social media investment |
| US-11 | Marketing Manager | Export analytics data as CSV | I can create custom reports for stakeholders |
For Sales / Customer Success
| ID | As a... | I want to... | So that... |
|---|---|---|---|
| US-12 | Sales Manager | See institutional subscription utilization rates | I can identify accounts at risk of churn |
| US-13 | Customer Success | Generate usage reports per institution | I can share data during renewal conversations |
For QA
| ID | As a... | I want to... | So that... |
|---|---|---|---|
| US-14 | QA Engineer | Verify GA4 events fire correctly on the Reader Portal | I can confirm the analytics pipeline is working |
| US-15 | QA Engineer | Confirm the Admin Console displays real data when GA4 is configured | I can validate the full data flow |
| US-16 | QA Engineer | Verify that declining cookie consent suppresses GA4 tracking | I can confirm privacy compliance |
20. Use Cases & Scenarios
Scenario 1: Monitoring a New Issue Launch
Context: New magazine issue published this week. Editor wants to measure reader response.
Steps:
- Open Dashboard -- check "Published (7d)" card for the new issue's articles
- Open Analytics -- set date range to "7d"
- Check Key Metrics -- expect a spike in Page Views and Unique Visitors
- Check Top Content -- new issue's articles should appear in the top 10
- Check Scroll Depth -- look for high completion rates (75-100%) indicating engaged readers
- Check Paywall Funnel -- if issue articles are premium, expect funnel activity
Scenario 2: Evaluating a Marketing Campaign
Context: Marketing ran a Facebook campaign to drive subscriptions.
Steps:
- Open Analytics -- set date range to cover the campaign period
- Check Traffic Sources -- "Social" percentage should be higher than baseline
- Open GA4 directly -- filter by
utm_source=facebookto see campaign-specific metrics - Check Subscription Metrics -- look for a spike in "New Subscribers"
- If conversion surfaces were used, check their stats for UTM attribution (
utm_campaign=cs_subscribe_paid_*)
Scenario 3: Institutional Renewal Preparation
Context: Sales team preparing for an institutional subscription renewal meeting.
Steps:
- Open Analytics > Institutional Usage
- Find the institution by name
- Note: seats used vs total, utilization rate, most active users
- Export the data as CSV for the renewal proposal
- If utilization is low, recommend engagement strategies; if high, propose additional seats
Scenario 4: Diagnosing a Conversion Drop
Context: MRR has dropped this month. Need to diagnose why.
Steps:
- Open Analytics -- compare 30d vs previous 30d
- Check Subscription Metrics -- is churn rate up, or are new subscribers down?
- Check Paywall Funnel -- are fewer people seeing paywalls (traffic drop)? Or is the funnel leaking?
- Check Traffic Sources -- has any channel dropped significantly?
- Check Top Content -- is popular content shifting away from premium articles?
- Check Device Breakdown -- is a mobile issue causing bounce rate increases?
| # | Scenario | Steps | Expected Result | Priority |
|---|---|---|---|---|
| A1 | page_view fires on navigation | Open any page on Reader Portal, check GA4 debug | page_view event with page_path | P0 |
| A2 | article_view fires | Open an article page | article_view with article_slug, article_section | P0 |
| A3 | article_scroll_depth 25% | Scroll to 25% of article | article_scroll_depth with scroll_depth: 25 | P0 |
| A4 | article_scroll_depth 50% | Scroll to 50% | scroll_depth: 50 | P1 |
| A5 | article_scroll_depth 75% | Scroll to 75% | scroll_depth: 75 | P1 |
| A6 | article_scroll_depth 100% + read_complete | Scroll to bottom | Both article_scroll_depth (100) and article_read_complete with read_time_seconds | P0 |
| A7 | paywall_view fires | Visit premium article as anonymous | paywall_view with article_slug | P0 |
| A8 | paywall_click_subscribe fires | Click "Subscribe" on paywall | paywall_click_subscribe with article_slug | P0 |
| A9 | subscribe_start fires | Begin checkout | subscribe_start with plan_name, plan_price | P1 |
| A10 | subscribe_complete fires | Complete payment | subscribe_complete with plan_name, payment_method | P1 |
| A11 | shop_product_view fires | Open shop product page | shop_product_view with product details | P1 |
| A12 | shop_add_to_cart fires | Click Add to Cart | shop_add_to_cart with product and quantity | P1 |
| A13 | shop_checkout_start fires | Click Checkout | shop_checkout_start with cart value | P1 |
| A14 | newsletter_view fires | Open newsletter edition | newsletter_view with slug | P2 |
| A15 | newsletter_scroll_depth fires | Scroll newsletter to 50% | newsletter_scroll_depth with depth | P2 |
| A16 | Conversion surface events | Trigger a conversion surface | impression, click, dismiss, conversion events all fire | P1 |
| A17 | coupon_copied fires | Copy coupon code from surface | coupon_copied with code | P2 |
| A18 | Scroll milestones fire once only | Scroll article up and down repeatedly | Each milestone (25/50/75/100) fires exactly once | P1 |
| # | Scenario | Steps | Expected Result | Priority |
|---|---|---|---|---|
| B1 | Cookie banner appears | Visit Reader Portal in incognito | Cookie consent banner visible | P0 |
| B2 | Accept cookies | Click "Accept" on cookie banner | hyphen_cookie_consent: accepted in localStorage, GA4 events fire | P0 |
| B3 | Decline cookies | Click "Decline" (if available) | GA4 events NOT sent to Google | P1 |
| B4 | Consent persists | Accept cookies, close tab, reopen | Banner does not reappear, GA4 tracking active | P1 |
| B5 | GA4 script present | Check page source | gtag.js loaded with correct Measurement ID | P0 |
| # | Scenario | Steps | Expected Result | Priority |
|---|---|---|---|---|
| C1 | Dashboard loads | Login to Admin Console | Welcome card + 4 stat cards + status cards | P0 |
| C2 | Stats show real data | Verify articles, subscribers, views, engagement | Numbers match database counts | P1 |
| C3 | Clickable cards navigate | Click "Pending Review" card | Opens Content page filtered to pending_review | P1 |
| C4 | Most Popular shows articles | Check Most Popular column | Top articles by view count displayed | P1 |
| C5 | Social overview shows | Check Social Overview widget | Scheduled/This Week/Failed counts | P2 |
| # | Scenario | Steps | Expected Result | Priority |
|---|---|---|---|---|
| D1 | Analytics page loads | Click Analytics in sidebar | Page renders with all sections | P0 |
| D2 | Date range: 7d | Select 7d in date picker | All metrics update for last 7 days | P0 |
| D3 | Date range: 30d | Select 30d (default) | All metrics for last 30 days | P0 |
| D4 | Date range: custom | Select custom dates | Metrics update for selected range | P1 |
| D5 | Key metrics cards show data | Check 4 top cards | Page Views, Unique Visitors, Sessions, Avg Duration with % change arrows | P0 |
| D6 | Traffic chart renders | Check line chart | Time-series with toggleable lines | P1 |
| D7 | Traffic sources show | Check Traffic Sources card | Percentage bars for each channel | P1 |
| D8 | Subscription metrics | Check Subscription section | Total, New, Churn Rate, MRR visible | P0 |
| D9 | Plan breakdown | Check By Plan section | Subscriber distribution across plans | P1 |
| D10 | Top content table | Check Top Content | Ranked articles with views, time, shares, comments | P1 |
| D11 | Paywall funnel renders | Check Paywall Conversion Funnel | 4 stages with counts and conversion rates | P1 |
| D12 | Scroll depth section | Check Content Engagement | 25/50/75/100% distribution bars | P1 |
| D13 | Device breakdown | Check Device Breakdown | Desktop/Mobile/Tablet percentages | P1 |
| D14 | Top countries | Check Top Countries | Country list with flags and percentages | P2 |
| D15 | Refresh button | Click Refresh icon | All data reloads, icon spins during loading | P2 |
| # | Scenario | Steps | Expected Result | Priority |
|---|---|---|---|---|
| E1 | CSV export works | Click Export on Analytics page | CSV file downloads with traffic + subscription data | P1 |
| E2 | Export with date range | Set 7d, then export | CSV contains only last 7 days of data | P1 |
| E3 | Export permission required | Login as user without ANALYTICS_EXPORT | Export button not visible | P2 |
| # | Scenario | Steps | Expected Result | Priority |
|---|---|---|---|---|
| F1 | GA4 not configured | No GA4 env vars set | Analytics page shows placeholder/empty data, no errors | P0 |
| F2 | GA4 configured | GA4 env vars set correctly | Real data appears from GA4 | P0 |
| F3 | GA4 connection error | Set invalid GA4 credentials | Graceful fallback to empty data, no crash | P1 |
| F4 | Subscription data always works | GA4 down or unconfigured | Subscription metrics still show (from Prisma DB) | P0 |
| # | Scenario | Steps | Expected Result | Priority |
|---|---|---|---|---|
| G1 | No analytics permission | Login as user without analytics:read | "Access Restricted" with lock icon | P1 |
| G2 | Read-only permission | Login with analytics:read only | Page visible, Export button hidden | P1 |
| G3 | Full permission | Login as admin | All features accessible including export | P1 |
| G4 | Social analytics permission | Login without social:analytics:read | Social Analytics page shows access denied | P2 |
| # | Scenario | Steps | Expected Result | Priority |
|---|---|---|---|---|
| H1 | Institutional metrics load | Navigate to Institutional Usage | List of institutions with utilization data | P1 |
| H2 | Usage reflects real data | Check seat counts and active users | Matches database records | P2 |
| # | Scenario | Steps | Expected Result | Priority |
|---|---|---|---|---|
| I1 | Empty state (no data) | Fresh install with no readers or content | All sections show empty/zero state, no errors | P1 |
| I2 | Large date range (12m) | Select 12 months | Charts render without performance issues | P2 |
| I3 | GA4 partial data | GA4 has traffic data but not scroll events | Available data shows, missing data shows "No data" | P2 |
| I4 | Multiple browser tabs | Open Analytics in 2 tabs simultaneously | Both tabs load correctly | P2 |
| Limitation | Description | Impact |
|---|---|---|
| GA4 data delay | GA4 Data API can have 24-48 hour lag for some metrics | Recent data may not reflect the very latest activity |
| No real-time traffic dashboard | Real-time monitoring shows placeholder data | Use GA4 real-time view directly for live monitoring |
| Cookie consent reduces data | Readers who decline cookies are invisible to GA4 | Traffic numbers may undercount actual visitors |
| Traffic trend chart not fully wired | fetchTrafficTrend() returns empty array | Time-series chart may show flat or no data |
| Geo data not fully wired | fetchGeoData() returns empty array | Top Countries may show limited data |
| PDF export is placeholder | generatePDFReport() returns placeholder data | Only CSV export is functional |
| No A/B test analytics | No built-in A/B testing framework | Use GA4's built-in experiments for A/B testing |
| Scroll depth is page-level | Scroll tracking measures page scroll, not article content scroll | For very long pages with headers/footers, 100% may not mean "finished article" |
| Social analytics depends on API connections | Social data only appears when Meta/X APIs are connected | Must configure social integrations first |
| Some GA4 events not yet wired to all call sites | See section 22.1 below for details | Certain GA4 events will not fire until wiring is completed |
All GA4 tracking functions are defined in reader-portal/src/lib/analytics.ts. However, not all functions are called from every relevant component. The table below shows current wiring status:
| Event | Function Defined | Wired to Components | Status |
|---|---|---|---|
article_scroll_depth | Yes | Yes -- observeScrollDepth() used in article templates | Fully wired |
article_read_complete | Yes | Yes -- fires at 100% scroll milestone | Fully wired |
newsletter_view | Yes | Yes -- NewsletterEditionDetail useEffect | Fully wired |
newsletter_scroll_depth | Yes | Yes -- observeNewsletterScrollDepth() in NewsletterEditionDetail | Fully wired |
newsletter_read_complete | Yes | Yes -- fires at 100% newsletter scroll | Fully wired |
newsletter_share | Yes | Yes -- NewsletterEditionDetail share handler | Fully wired |
newsletter_list_view | Yes | Yes -- NewsletterEditionGrid useEffect | Fully wired |
conversion_surface_impression | Yes | Yes -- ConversionSurfaceRenderer + InlineEmbedSurface | Fully wired |
conversion_surface_click | Yes | Yes -- ConversionSurfaceProvider | Fully wired |
conversion_surface_dismiss | Yes | Yes -- ConversionSurfaceProvider | Fully wired |
conversion_surface_conversion | Yes | Yes -- ConversionSurfaceProvider | Fully wired |
coupon_copied | Yes | Yes -- all 5 surface components | Fully wired |
article_view | Yes | Not yet wired to article page templates | Pending |
paywall_view | Yes | Not yet wired to PaywallOverlay/ArticlePaywallGate | Pending |
paywall_click_subscribe | Yes | Not yet wired to paywall CTA handlers | Pending |
subscribe_start | Yes | Not yet wired to checkout page mount | Pending |
subscribe_complete | Yes | Not yet wired to payment verification success | Pending |
registration_start | Yes | Not yet wired to register page | Pending |
newsletter_signup | Yes | Not yet wired to newsletter form submissions | Pending |
shop_product_view | Yes | Not yet wired to shop product page | Pending |
shop_add_to_cart | Yes | Not yet wired to CartProvider addItem | Pending |
shop_checkout_start | Yes | Not yet wired to cart checkout redirect | Pending |
Impact on admin analytics:
- The Paywall Conversion Funnel (Section 7) depends on
paywall_view,paywall_click_subscribe,subscribe_start, andsubscribe_completeevents. Until these are wired, the funnel will show zero counts. - Content Performance scroll depth data works correctly (fully wired via
observeScrollDepth). - Newsletter analytics are fully functional.
- Conversion surface analytics are fully functional.
- Shop/e-commerce analytics will not populate until shop events are wired.
Note for QA: When testing the Paywall Funnel and subscription events, expect zero data until the pending events are wired. This is a known implementation gap, not a bug. The tracking functions exist and are correct — they just need to be called from the appropriate component lifecycle hooks.
| Term | Definition |
|---|---|
| ARR | Annual Recurring Revenue (MRR x 12) |
| ARPU | Average Revenue Per User (MRR / active subscribers) |
| Bounce Rate | % of visitors who leave after viewing only one page |
| Channel | Traffic source category (Organic, Direct, Social, Referral, Email, Paid) |
| Churn Rate | % of subscribers who cancel in a period |
| Conversion Rate | % of visitors who complete a desired action |
| CTR | Click-Through Rate (clicks / impressions x 100) |
| GA4 | Google Analytics 4 -- Google's analytics platform |
| GA4 Data API | Server-side API for querying GA4 data programmatically |
| gtag.js | Google's JavaScript tracking library loaded on the Reader Portal |
| KPI | Key Performance Indicator -- a measurable value showing effectiveness |
| LTV | Lifetime Value -- estimated total revenue from one subscriber |
| Measurement ID | GA4 property identifier (format: G-XXXXXXXXXX) |
| MRR | Monthly Recurring Revenue -- predictable monthly subscription income |
| Scroll Depth | How far down a reader scrolled (measured at 25/50/75/100%) |
| Session | A group of interactions in a single visit (ends after 30min inactivity) |
| UTM | Urchin Tracking Module -- URL parameters for campaign tracking |
| Utilization Rate | For institutions: active users / total seats |