Analytics & Reporting
Complete guide to the analytics dashboard, content metrics, subscription tracking, and report exports
1. Feature Overview
The Analytics & Reporting module gives you a clear picture of how your publishing platform is performing. It answers questions like:
- How many people are reading your content?
- Which articles are most popular?
- How are subscriptions growing?
- Where is your traffic coming from?
- How well are paywalls converting readers to subscribers?
- How are your social media posts performing?
- How are institutional subscribers using their access?
The module has three main areas you will use:
| Area | Where to Find It | What It Shows |
|---|---|---|
| Dashboard | Sidebar > Dashboard | Quick snapshot of today's activity: articles, subscribers, views, engagement, moderation queue, social overview |
| Analytics Overview | Sidebar > Analytics | Detailed traffic, subscription, content performance, device, and geographic data with charts and filters |
| Social Analytics | Sidebar > Social > Analytics | Social media post performance, follower growth, platform comparisons, best posting times |
All analytics pages show data visually using charts, metric cards, and tables so you can quickly understand trends without reading raw numbers.
2. Who Should Use This Feature
| Role | What You Will Use | Why |
|---|---|---|
| Editors / Chief Editors | Dashboard, Analytics Overview, Top Content | Track which articles perform best, identify trending topics, review content quality metrics |
| Product Managers | Analytics Overview, Subscription Metrics, Paywall Funnel | Monitor product growth, conversion rates, and subscriber behavior |
| Marketing Managers | Analytics Overview, Social Analytics, Traffic Sources | Understand campaign effectiveness, social reach, and traffic attribution |
| Sales Managers | Analytics Overview, Institutional Usage | Review institutional subscription utilization for renewals and upselling |
| Operations / Admin | All analytics pages, Export | Monitor overall platform health, generate reports for stakeholders |
| QA Team | All analytics pages | Verify data accuracy, test filters and exports, validate GA4 integration |
| Customer-Facing Teams | Institutional Usage, Subscription Metrics | Prepare usage reports for institutional clients, track account health |
3. Before You Begin
Prerequisites
Before analytics data will appear in the Admin Console, the following must be in place:
Required
-
Google Analytics 4 (GA4) must be configured
- GA4 provides traffic data (page views, visitors, sessions), content performance data (time on page, scroll depth), traffic source breakdown, and device/geographic data.
- Without GA4, these sections will show placeholder or empty data.
- GA4 setup is done in Settings > Integrations (see Section 5).
-
Reader Portal must be live
- The Reader Portal fires tracking events to GA4 when readers view articles, scroll, hit paywalls, subscribe, and interact with content.
- If the Reader Portal is not deployed or GA4 tracking code is not installed on it, reader behavior data will not flow into your analytics.
-
You must have the right permissions
- To view analytics: You need the Analytics Read permission.
- To export reports: You need the Analytics Export permission.
- To view social analytics: You need the Social Analytics Read permission.
- To view the executive social summary: You need the Social Executive Read permission.
- If you see an "Access Restricted" screen with a lock icon when opening Analytics, contact your administrator to request access.
Optional but Recommended
-
Subscription plans should be configured — For subscription metrics (MRR, churn, plan breakdown) to be meaningful, you need active subscription plans with real subscribers.
-
Social media accounts should be connected — For social analytics to show data, at least one social account (Facebook, Instagram, X/Twitter) must be connected in Settings > Integrations > Social Media.
-
Institutional subscriptions should be set up — For institutional usage reporting, institutions must be created and have active subscriptions with assigned seats.
4. Key Terms in Simple Language
| Term | What It Means |
|---|---|
| Page Views | The total number of times any page was loaded by any visitor. One person visiting 3 pages = 3 page views. |
| Unique Visitors | The number of different people who visited your site. One person visiting 3 pages = 1 unique visitor. |
| Sessions | A group of interactions by one visitor in a single visit. If someone comes in the morning and again in the evening, that counts as 2 sessions. |
| Avg. Session Duration | How long, on average, each visit lasts before the person leaves. |
| Bounce Rate | The percentage of visitors who land on a page and leave without clicking anything else. A high bounce rate may mean the content is not engaging or the page loaded slowly. |
| MRR (Monthly Recurring Revenue) | The predictable subscription income you earn each month. If 100 subscribers pay $10/month, MRR = $1,000. |
| ARR (Annual Recurring Revenue) | MRR multiplied by 12. It projects your yearly subscription income. |
| Churn Rate | The percentage of subscribers who cancel in a given period. Lower is better. |
| ARPU (Average Revenue Per User) | Total revenue divided by total subscribers. Shows how much each subscriber is worth on average. |
| LTV (Lifetime Value) | An estimate of how much revenue a subscriber will generate over their entire subscription lifetime. |
| Conversion Rate | The percentage of visitors who complete a desired action (e.g., subscribing after seeing a paywall). |
| Traffic Sources | Where your visitors come from: search engines (Organic), typing your URL (Direct), social media (Social), other websites (Referral), email links (Email), or paid ads (Paid). |
| Paywall Funnel | The step-by-step journey from a reader seeing a paywall to completing a subscription. Each step shows how many people continued vs. dropped off. |
| Impressions | The number of times a social post was displayed to people (they may or may not have engaged with it). |
| Reach | The number of unique people who saw a social post. |
| Engagement Rate | The percentage of people who interacted with a post (liked, commented, shared, clicked) out of those who saw it. |
| Scroll Depth | How far down a reader scrolled on an article page (25%, 50%, 75%, or 100%). |
| GA4 | Google Analytics 4 — the analytics service from Google that tracks visitor behavior on your website. |
| Utilization Rate | For institutional subscriptions: the percentage of assigned seats that are actively being used. |
5. Step-by-Step Setup Guide
5.1 Configure Google Analytics 4 (GA4)
GA4 is the primary source of traffic and reader behavior data. You must configure it before most analytics features will show real data.
What you need before starting:
- A GA4 property set up in Google Analytics (your technical team will have created this).
- The Measurement ID (format:
G-XXXXXXXXXX) — found in GA4 under Admin > Data Streams. - The Property ID (a 9+ digit number) — found in GA4 under Admin > Property Settings.
- A Service Account Key (a JSON file) — your technical team creates this in Google Cloud Console to allow the Admin Console to pull data from GA4.
Steps:
- In the Admin Console, click Settings in the sidebar.
- Click Integrations.
- Find the Analytics section on the page.
- Click Configure on the Google Analytics 4 card.
- A modal titled "Configure Google Analytics 4" will open.
- Enter the following:
- Measurement ID — Paste your Measurement ID (e.g.,
G-ABC1234567). - Property ID — Paste your Property ID (e.g.,
123456789). - Service Account Key (JSON) — Paste the full contents of the JSON key file your technical team provided. It starts with
{"type": "service_account", ...}.
- Measurement ID — Paste your Measurement ID (e.g.,
- Click Save.
- The integration card should now show a connected/active status.
Important: The Measurement ID must start with
G-followed by at least 10 alphanumeric characters. The Property ID must be a number with 9 or more digits. If either format is wrong, the connection will fail silently.
5.2 Verify GA4 Tracking on the Reader Portal
After GA4 is configured in the Admin Console, your technical team also needs to ensure:
- The GA4 tracking script (
gtag.js) is installed on the Reader Portal. - The cookie consent banner is functioning (analytics data only flows after consent is granted by readers).
- Custom events (article views, scroll depth, paywall views, subscription events) are firing correctly.
You can verify this by:
- Opening the Reader Portal in a browser.
- Opening the browser's Developer Tools (press F12 or right-click > Inspect).
- Going to the Network tab and filtering for
google-analyticsorgtag. - Navigating to an article — you should see network requests being sent to Google Analytics.
This step is for QA/technical verification. Most users will not need to do this.
5.3 Permissions Setup
If team members cannot see the Analytics page, an administrator needs to assign the correct permissions.
The relevant permissions are:
| Permission | What It Allows |
|---|---|
analytics:read | View the Analytics Overview page and all charts/metrics |
analytics:export | Download CSV/JSON reports from Analytics |
social:analytics:read | View the Social Analytics page |
social:executive:read | View the Executive tab on Social Analytics |
These permissions are assigned through roles:
| Role | Analytics Access |
|---|---|
| Admin | Full access (view + export + social + executive) |
| Editor | View + Export + Social Analytics |
| Chief Editor | View + Export |
| Marketing Manager | View + Export |
| Moderator | View only |
| Sales Manager | View only |
To change a user's role, go to Settings > Users and update their role assignment.
6. How to Verify It Worked
After completing setup, here is how to confirm analytics is functioning:
Quick Verification Checklist
| Check | How to Verify | Expected Result |
|---|---|---|
| GA4 connection | Go to Settings > Integrations and check the GA4 card | Status should show as connected/active |
| Analytics page loads | Click Analytics in the sidebar | The page should load with 4 metric cards at the top (Page Views, Unique Visitors, Sessions, Avg. Session Duration) |
| Traffic data appears | Look at the metric cards and Traffic chart | Numbers should be non-zero if the Reader Portal has had visitors |
| Traffic Sources show | Look at the Traffic Sources card on the right | Should show percentage bars for Organic Search, Direct, Social, Referral, Email, Paid |
| Subscription metrics show | Scroll down to the Subscription Metrics section | Should show Total Subscribers, New Subscribers, Churn Rate, MRR |
| Top Content shows | Scroll down to the Top Content section | Should list your most-viewed articles with page views, time on page, shares, comments |
| Device Breakdown shows | Scroll down to the Device Breakdown card | Should show Desktop, Mobile, and Tablet percentages |
| Top Countries show | Scroll down to the Top Countries card | Should list countries with flag icons and percentage of traffic |
| Export works | Click the Export button in the top-right | A CSV file should download to your computer |
| Date range works | Click the date range picker and select Last 7 Days | All charts and metrics should update to show only the last 7 days of data |
If Data Is Missing
- If all metrics show zero or placeholder data, GA4 may not be configured correctly. Go to Settings > Integrations and re-check your GA4 configuration.
- If traffic data is missing but subscription data shows, GA4 may be down or misconfigured, but the platform database is working. Traffic and content data come from GA4; subscription data comes from the platform database.
- If you see "Access Restricted" with a lock icon, you do not have the
analytics:readpermission. Contact your administrator.
7. Using the Dashboard
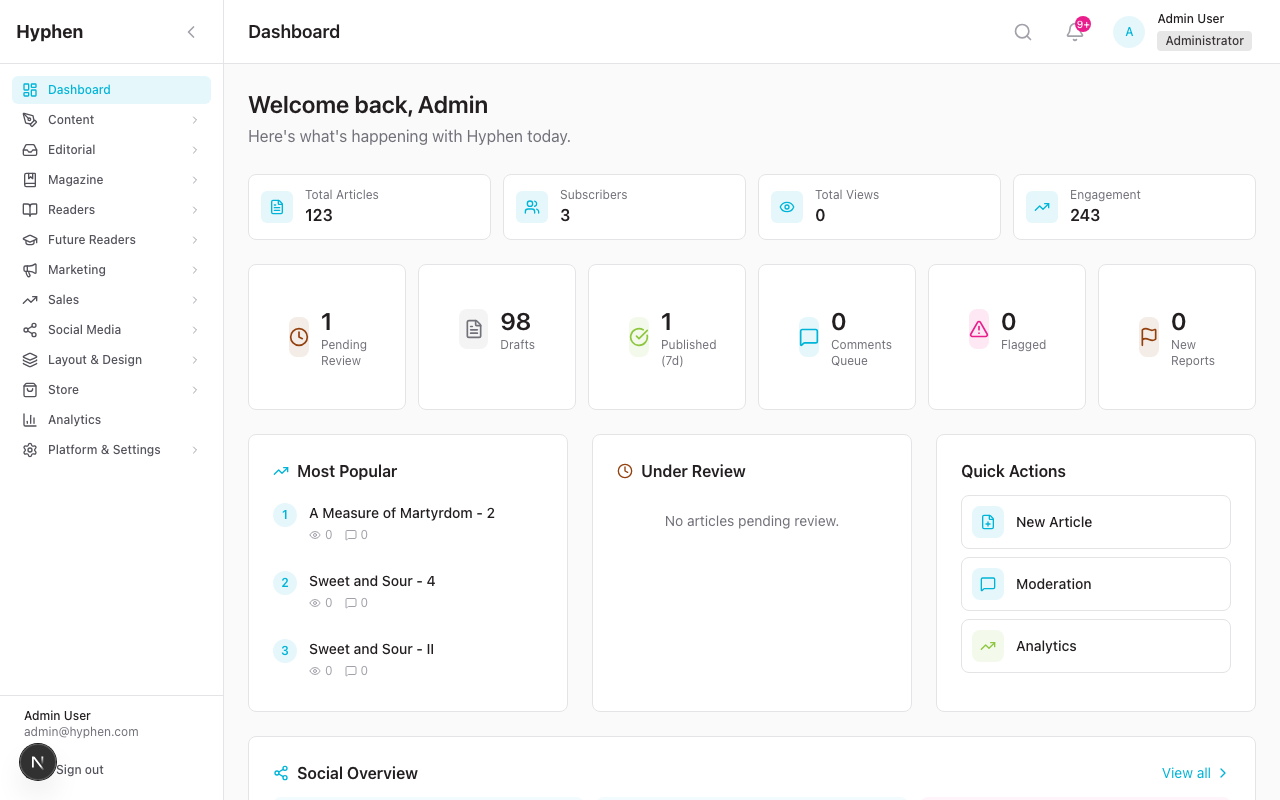
The Dashboard is the first page you see when you log into the Admin Console. It provides a quick daily snapshot.
How to Access
Click Dashboard in the sidebar, or it loads automatically when you log in.
What You See
Welcome Section
- A personalized greeting: "Welcome back, [Your Name]"
- Subtitle: "Here's what's happening with Hyphen today."
Primary Stats (4 cards across the top)
| Card | What It Shows |
|---|---|
| Total Articles | Total number of articles in the system (all statuses) |
| Subscribers | Number of active subscribers, with "+X this month" showing new subscribers this month |
| Total Views | Total article views across all content |
| Engagement | Combined count of comments + shares, with breakdown shown below |
Content & Moderation Status (6 smaller cards)
| Card | What It Shows | Clickable? |
|---|---|---|
| Pending Review | Articles waiting for editorial review | Yes — opens Content page filtered to pending review |
| Drafts | Articles in draft status | Yes — opens Content page filtered to drafts |
| Published (7d) | Articles published in the last 7 days | No |
| Comments Queue | Comments awaiting moderation | Yes — opens Moderation page |
| Flagged | Comments flagged by readers or auto-moderation | Yes — opens Moderation page |
| New Reports | New content/comment reports from readers | Yes — opens Moderation page |
Three-Column Section
| Column | What It Shows |
|---|---|
| Most Popular | Top articles ranked by view count, with views and comment count. Click any article to open it. |
| Under Review | Articles currently pending editorial review, with author and last update date. Click to open. |
| Quick Actions | Shortcuts to New Article, Moderation, and Analytics |
Social Overview Widget
| Metric | What It Shows |
|---|---|
| Scheduled Today | Number of social posts scheduled for today |
| This Week | Number of social posts scheduled for the current week |
| Failed | Number of social posts that failed to publish (shown in red if > 0, with a clickable alert) |
Quick links:
- Compose Post — Opens the social post creation page
- Social Analytics — Opens the Social Analytics page
Recently Published
A grid showing the last 6 published articles with:
- Article title
- Author name
- View count, comment count, and share count
- Click any article to open its detail page
- "View all" link to see all published articles
8. Using the Analytics Overview Page
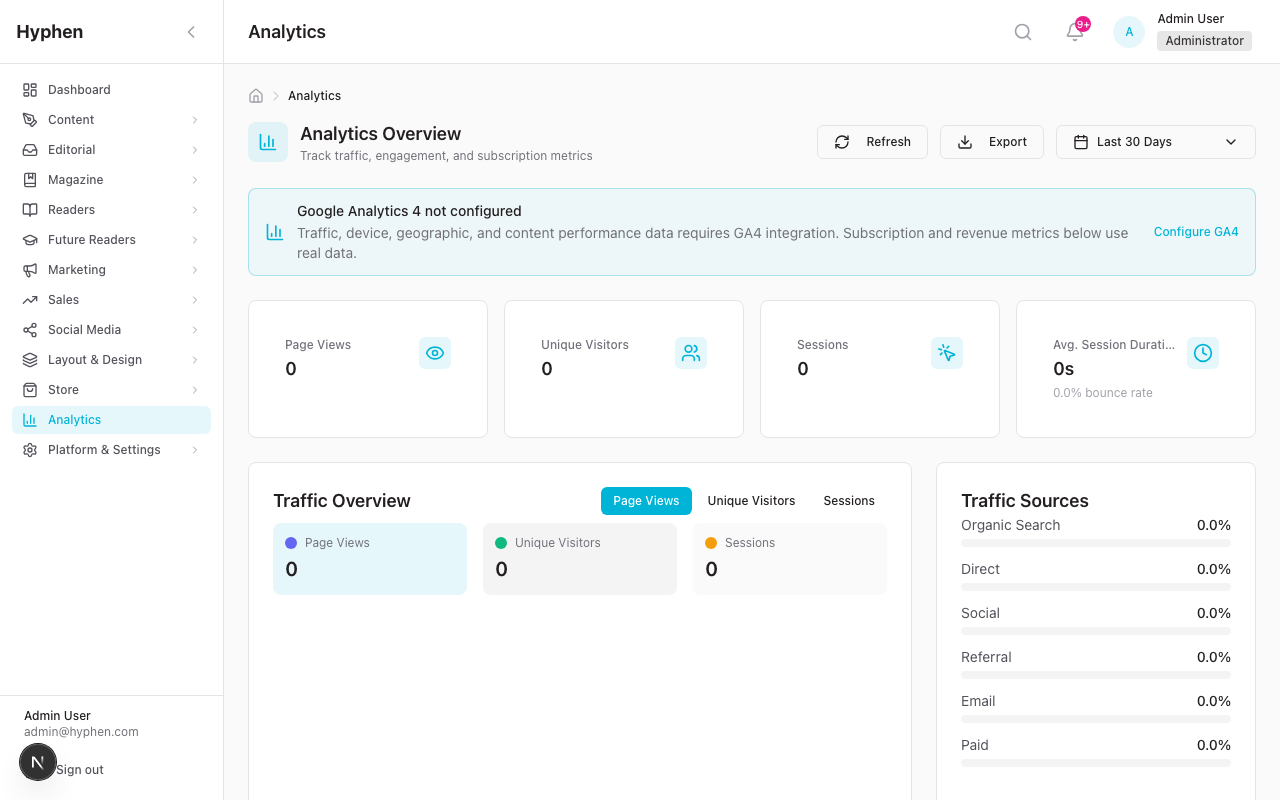
The Analytics Overview page is the most detailed analytics view in the platform. It provides traffic, subscription, content, device, and geographic data in one place.
How to Access
Click Analytics in the sidebar.
Page Header and Controls
At the top of the page you will see:
- Page title: "Analytics Overview"
- Description: "Track traffic, engagement, and subscription metrics"
- Breadcrumb: Analytics
Action buttons (top right):
| Button | What It Does |
|---|---|
| Refresh | Reloads all data on the page. The icon spins while refreshing. |
| Export | Downloads a CSV report of traffic and subscription data for the selected date range. Only visible if you have the Export permission. |
| Date Range Picker | A dropdown that lets you choose the time period for all data on the page. |
Date Range Picker
The date range picker controls the time period for all charts and metrics on the page. When you change it, the entire page reloads with data for the new period.
Preset options:
| Option | Period |
|---|---|
| 7d | Last 7 days |
| 30d | Last 30 days (default) |
| 90d | Last 90 days |
| 12m | Last 12 months |
| Custom | Opens start date and end date inputs so you can pick any custom range |
How to use:
- Click the date range button (it shows the currently selected range).
- A dropdown appears with the preset buttons.
- Click a preset (e.g., 7d) to select it immediately.
- Or click Custom, then enter a Start Date and End Date, then the data will update.
Key Metrics Cards (top row)
Four metric cards appear at the top, showing the most important numbers:
| Card | Icon | What It Shows | Comparison |
|---|---|---|---|
| Page Views | Eye | Total page loads across all content | Shows % change vs. previous period (arrow up/down) |
| Unique Visitors | People | Number of distinct visitors | Shows % change vs. previous period |
| Sessions | Click | Total browsing sessions | Shows % change vs. previous period |
| Avg. Session Duration | Clock | Average length of a visit | Shows bounce rate as subtitle text |
How to read the comparison:
- A green upward arrow with a percentage (e.g., "+12.5%") means the metric improved compared to the previous equivalent period.
- A red downward arrow means the metric decreased.
- The comparison period matches your selected date range. If you selected "Last 30 days," the comparison is against the 30 days before that.
Traffic Chart
Below the metric cards, a large line chart takes up two-thirds of the width.
What it shows: A time-series visualization of traffic trends over your selected date range.
Metric toggles: Above the chart, you can toggle which lines are visible:
- Page Views — total page loads
- Unique Visitors — distinct visitors
- Sessions — browsing sessions
Click a toggle to show or hide that metric's line on the chart. You can show all three at once or just one.
How to read it:
- The X-axis shows dates.
- The Y-axis shows the count.
- Hover over any point on the line to see the exact value and date in a tooltip.
- Below the chart, summary stats show the totals for each metric.
Traffic Sources Card
To the right of the Traffic Chart, a card titled "Traffic Sources" shows where your visitors come from.
Sources displayed:
| Source | What It Means | Color |
|---|---|---|
| Organic Search | Visitors who found you through Google, Bing, etc. | Green |
| Direct | Visitors who typed your URL directly or used a bookmark | Blue |
| Social | Visitors who came from social media links | Purple |
| Referral | Visitors who came from links on other websites | Orange |
| Visitors who clicked links in emails or newsletters | Blue | |
| Paid | Visitors who came from paid advertising campaigns | Red |
Each source shows a horizontal progress bar and a percentage. The percentages add up to 100%.
Subscription Metrics Section
Below the traffic section, a card shows subscription health:
Top-level metrics (4 small cards):
| Metric | What It Shows |
|---|---|
| Total Subscribers | Current total active subscribers |
| New Subscribers | New subscribers gained in the selected period |
| Churn Rate | Percentage of subscribers who canceled |
| MRR | Monthly Recurring Revenue in currency |
By Plan breakdown: Below the metrics, a list shows how subscribers are distributed across your subscription plans (e.g., "Basic: 45%", "Premium: 30%", "Annual: 25%") with horizontal progress bars.
Subscriber Trend: A mini sparkline chart shows the subscriber count trend over time.
Additional stats at the bottom:
| Stat | What It Shows |
|---|---|
| Conversion Rate | What percentage of visitors convert to paid subscribers |
| ARPU | Average Revenue Per User |
| LTV | Estimated Lifetime Value per subscriber |
Top Content Section
Next to subscription metrics, a table titled "Top Content" shows your best-performing articles.
Columns:
| Column | What It Shows |
|---|---|
| Rank | Position (1, 2, 3...) based on performance |
| Title | Article title with section badge and author name |
| Page Views | Number of times the article was viewed |
| Time on Page | Average time readers spent on the article |
| Shares | Number of times the article was shared |
| Comments | Number of comments on the article |
Click any article row to navigate to that article's detail page in the content management section.
Device Breakdown Card
Shows what devices your visitors use:
| Device | Icon | Example Reading |
|---|---|---|
| Desktop | Monitor | 62% |
| Mobile | Smartphone | 31% |
| Tablet | Tablet | 7% |
Each device shows a circular icon, the device name, and the percentage of traffic. Use this to understand whether your audience primarily reads on desktop or mobile, which can inform design and layout decisions.
Top Countries Card
Shows the geographic distribution of your traffic:
- Lists the top 5 countries by traffic percentage.
- Each country shows a flag emoji, country name, and percentage.
- A globe icon appears in the card header.
Example:
| Flag | Country | Traffic |
|---|---|---|
| India | 42.3% | |
| United States | 23.1% | |
| United Kingdom | 12.8% |
"Need More Detailed Analytics?" Banner
At the bottom of the page, a banner offers a link to open the full Google Analytics dashboard for deeper analysis:
- Text: "Need more detailed analytics?"
- Subtitle: "Access the full Google Analytics dashboard for in-depth analysis"
- Button: "Open Google Analytics" — opens Google Analytics in a new browser tab.
9. Using Social Media Analytics
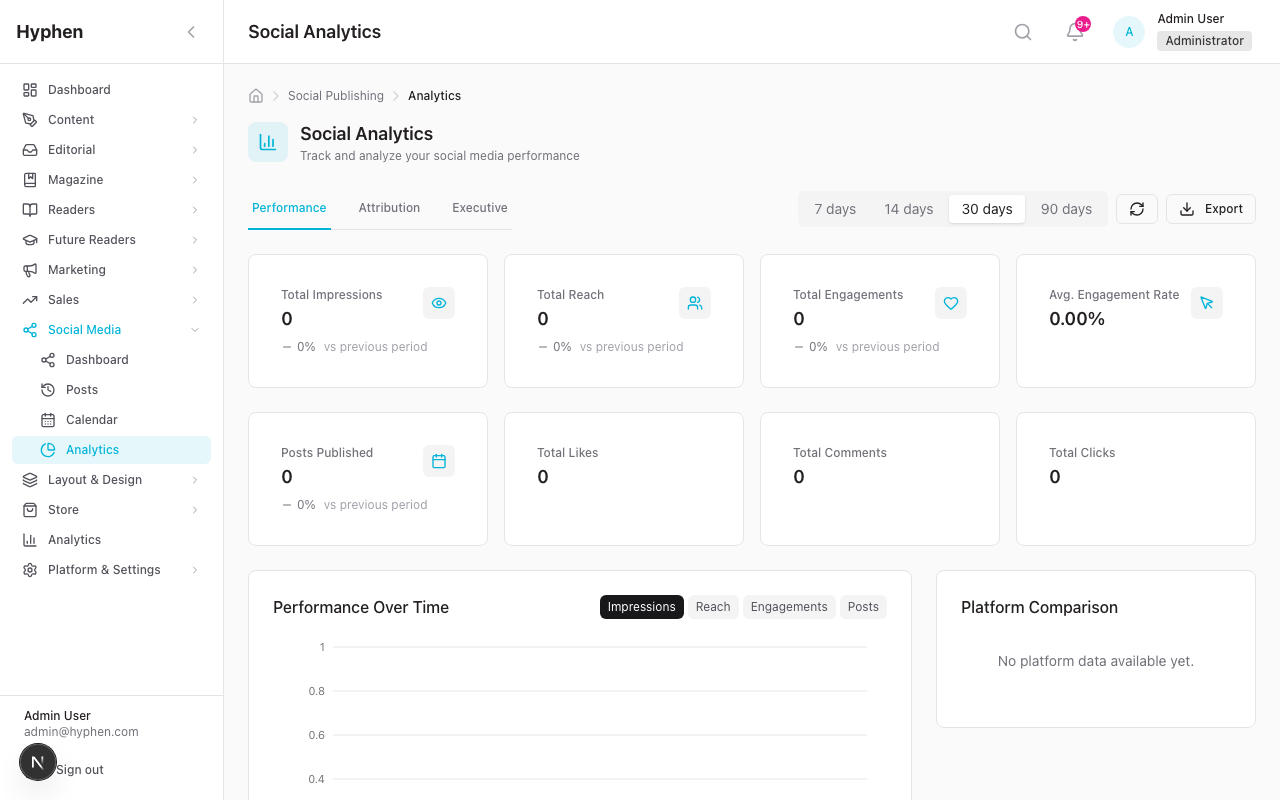
The Social Analytics page provides detailed performance data for your connected social media accounts.
How to Access
Click Social in the sidebar, then click Analytics. Or from the Dashboard, click the Social Analytics quick action.
Page Controls
- Date Range: Select a period (7, 14, 30, or 90 days) to filter all data.
- Refresh: Reload the latest data.
- Export: Download social analytics as CSV.
Tabs
The page has multiple tabs:
Performance Tab
First row of metrics (4 cards):
- Total Impressions — How many times your posts were displayed
- Total Reach — How many unique people saw your posts
- Total Engagements — Total likes, comments, shares, clicks
- Avg. Engagement Rate — Engagements as a percentage of impressions
Second row (4 cards):
- Posts Published — Number of posts published in the period
- Total Likes — Sum of all likes
- Total Comments — Sum of all comments
- Total Clicks — Sum of all link clicks
Charts and tables:
- Performance Over Time — Line chart showing trends over the selected period
- Platform Comparison — Side-by-side comparison of Facebook, Instagram, and X/Twitter performance
- Follower Growth Chart — Shows how your follower counts changed over time, with one line per connected account
- Content Type Breakdown — Table showing which content types (Text Only, Link Share, Image, Video, Mixed Media) perform best
- Best Times Heatmap — A 7-day by 24-hour heatmap showing when your audience is most engaged. Darker colors = higher engagement. Use this to schedule posts at optimal times.
- Top Posts Table — Your best-performing posts ranked by engagement, showing the post content, platform, impressions, reach, engagements, and engagement rate
- Hashtag Performance — Table showing which hashtags drive the most engagement
Attribution Tab
Shows how social media drives traffic to your website:
- Social Attribution Funnel — Impressions > Link Clicks > Click Rate
- Platform Traffic Breakdown — Which platforms send the most traffic
- Campaign Attribution Table — If you use campaign tracking, shows which campaigns drive results
Executive Tab
A high-level summary designed for leadership (requires the Social Executive Read permission):
- Period Selector — Choose 7, 14, 30, or 90 days
- Account Selector — View all accounts or a specific one
- KPI Cards with goal progress rings showing progress toward targets
- Period Comparison — Current period vs. previous period
- Top Campaigns — Best-performing campaigns
10. Exporting Reports
You can download analytics data as files for use in spreadsheets, presentations, or external reporting tools.
From the Analytics Overview Page
- Go to Analytics in the sidebar.
- Set the date range you want to export.
- Click the Export button (download icon) in the top-right.
- A CSV file will automatically download to your computer.
- The filename will be:
analytics-report-YYYY-MM-DD.csv
What the export includes:
- Traffic Sources (Source, Medium, Sessions, Active Users, Bounce Rate)
- Subscription data (Email, Plan, Status, Created At, Canceled At)
Note: If GA4 is not configured, the traffic sections in the export will show "GA4 not configured" instead of data.
From the Social Analytics Page
- Go to Social > Analytics.
- Set the desired date range.
- Click the Export button.
- Choose CSV or JSON format.
What the social export includes:
- Period summary metrics
- Platform breakdown
- Individual post metrics
Export Permissions
Only users with the Analytics Export permission can see and use the Export button. If you do not see it, contact your administrator.
11. Understanding Where Your Data Comes From
Analytics data in the Admin Console comes from two main sources. Understanding this helps you troubleshoot when data looks unexpected.
Data Source Map
| What You See | Where It Comes From | How It Gets There |
|---|---|---|
| Page Views, Unique Visitors, Sessions | GA4 | Reader Portal sends page view events to GA4 via the tracking script |
| Avg. Session Duration, Bounce Rate | GA4 | Calculated by GA4 from session data |
| Traffic Sources (Organic, Direct, etc.) | GA4 | GA4 classifies traffic using UTM parameters and referrer headers |
| Top Content (page views, time on page) | GA4 | GA4 tracks which article pages get the most views |
| Device Breakdown | GA4 | GA4 identifies the device type from the visitor's browser |
| Top Countries | GA4 | GA4 determines geography from IP addresses |
| Scroll Depth | GA4 | Reader Portal fires custom events at 25%, 50%, 75%, 100% scroll |
| Paywall Funnel | GA4 | Reader Portal fires events: paywall_view, subscribe_click, checkout_start, subscribe_complete |
| Total Subscribers, New Subscribers | Platform Database | Subscription records stored in the platform's own database |
| Churn Rate, MRR, ARR | Platform Database | Calculated from subscription and payment records |
| ARPU, LTV, Conversion Rate | Platform Database | Derived metrics calculated from subscriber and revenue data |
| Subscription by Plan | Platform Database | Counts subscribers per plan from the database |
| Total Articles, Drafts, Pending Review | Platform Database + Strapi CMS | Article counts from the content management system |
| Comments, Shares (engagement) | Platform Database | Comment and share records stored in the database |
| Social post metrics | Platform Database | Metrics pulled from social platforms and stored locally |
| Institutional Usage | Platform Database | Calculated from login sessions and reading history records |
Reader Portal Events That Feed Analytics
When a reader uses the Reader Portal, these events are automatically tracked (if GA4 and cookie consent are configured):
| Reader Action | Event Tracked | Where It Shows Up |
|---|---|---|
| Opens an article | Article View | Page Views, Top Content |
| Scrolls through an article | Scroll Depth (25%, 50%, 75%, 100%) | Engagement metrics |
| Finishes reading an article | Article Read Complete | Content performance |
| Hits a paywall | Paywall View | Paywall Funnel |
| Clicks "Subscribe" on paywall | Paywall Click Subscribe | Paywall Funnel |
| Starts subscription checkout | Subscribe Start | Paywall Funnel |
| Completes subscription | Subscribe Complete | Paywall Funnel, Subscription metrics |
| Shares an article | Article Share | Top Content shares column |
| Signs up for newsletter | Newsletter Signup | Conversion tracking |
| Starts registration | Registration Start | Registration Funnel |
| Views a product (shop) | Product View | E-commerce tracking |
| Adds to cart | Add to Cart | E-commerce tracking |
| Sees a conversion surface (banner, modal, etc.) | Conversion Surface Impression | Campaign/conversion tracking |
| Clicks a conversion surface CTA | Conversion Surface Click | Campaign/conversion tracking |
| Copies a coupon code | Coupon Copied | Campaign tracking |
Important: These events only fire if the reader has accepted cookie consent on the Reader Portal. If consent is denied, GA4 will not receive data from that reader's session.
12. Worked Examples
Example 1: Checking Which Articles Performed Best This Week
Scenario: The editorial team wants to see which articles got the most attention in the past 7 days to inform next week's editorial planning.
Steps:
- Click Analytics in the sidebar.
- In the top-right, click the date range picker.
- Click 7d to select the last 7 days.
- Wait for the page to reload with updated data.
- Scroll down to the "Top Content" section.
- Review the table:
- Rank 1 is your most-viewed article.
- Check the Page Views column for total views.
- Check Time on Page to see which articles held attention longest.
- Check Shares and Comments to see which articles sparked the most engagement.
- Click on any article title to go to its content detail page for more information.
What to look for:
- Articles with high views AND high time-on-page are genuinely engaging.
- Articles with high views but low time-on-page may have clickbait titles but disappointing content.
- Articles with low views but high shares may be niche but highly valued by their audience.
Example 2: Reviewing Subscription and Revenue Growth Over a Quarter
Scenario: The product team needs to report on subscription growth and revenue for the last quarter.
Steps:
- Click Analytics in the sidebar.
- Click the date range picker and select 90d (last 90 days).
- Review the Key Metrics Cards at the top:
- Note the Page Views and Unique Visitors to understand overall traffic trends.
- Check the comparison arrows — are they up or down compared to the prior 90 days?
- Scroll down to the Subscription Metrics section:
- Total Subscribers — Current subscriber count.
- New Subscribers — How many new subscribers were gained in the last 90 days.
- Churn Rate — What percentage canceled.
- MRR — Current monthly recurring revenue.
- Look at the By Plan breakdown to see which plans are most popular.
- Check the subscriber trend sparkline for growth direction.
- Note the Conversion Rate, ARPU, and LTV at the bottom.
- To share this data, click the Export button to download a CSV report.
What to look for:
- MRR should ideally be growing month over month.
- If churn rate is rising, investigate why subscribers are leaving.
- If conversion rate is low, the paywall or pricing may need adjustment.
Example 3: Checking Whether a Paywall or Campaign Is Converting Well
Scenario: Marketing launched a new campaign last week with a special paywall offer. They want to know if it is driving subscriptions.
Steps:
- Click Analytics in the sidebar.
- Set the date range to 7d.
- Look at the Page Views and Unique Visitors cards — has traffic increased?
- Check Traffic Sources — Is the campaign's channel (e.g., Email, Social, Paid) showing a higher percentage than usual?
- Scroll to Subscription Metrics:
- Are New Subscribers higher than the previous period?
- Has the Conversion Rate improved?
- For social campaign effectiveness, go to Social > Analytics:
- Check the Attribution Tab to see how much traffic social posts drove.
- Look at the Top Posts Table to see which campaign posts performed best.
- Compare the current period numbers with the previous period (shown as % change on metric cards).
What to look for:
- A successful campaign shows increased traffic from the campaign channel AND improved subscription conversion.
- If traffic is up but conversions are flat, the landing page or paywall offer may need improvement.
- If the campaign channel shows low traffic, the campaign distribution may not be reaching enough people.
Example 4: Reviewing Institutional Usage for a Customer Account
Scenario: The sales team has a renewal meeting with an institutional client and needs to show how their staff has been using the platform.
Steps:
- The institutional usage data is available through the Admin Console's analytics API.
- Ask your administrator or product team for an institutional usage report, which includes:
- Total Users vs. Active Users for the institution
- Content Accessed — Number of articles read by the institution's users
- Recent Logins — Login activity over the selected period
- Utilization Rate — Percentage of assigned seats being actively used (active users / total seats)
- Key metrics to present to the client:
- High utilization rate (above 70%) shows the subscription is well-used and worth renewing.
- Low utilization rate (below 30%) may mean the institution needs onboarding support or awareness campaigns.
- Content accessed count shows the value delivered.
What to look for:
- If utilization is declining, reach out proactively before the renewal conversation.
- If certain departments use it heavily and others do not, suggest targeted onboarding.
Example 5: Troubleshooting Why Analytics Data Is Missing or Incomplete
Scenario: An editor opens the Analytics page and sees zeros everywhere, or some sections show data while others are blank.
Diagnostic Steps:
Step 1: Check if GA4 is configured
- Go to Settings > Integrations.
- Find the Google Analytics 4 card.
- If it shows "Not configured" or "Inactive":
- Click Configure and verify the Measurement ID, Property ID, and Service Account Key are entered correctly.
- The Measurement ID must start with
G-(e.g.,G-ABC1234567). - The Property ID must be a 9+ digit number.
- The Service Account Key must be valid JSON starting with
{"type": "service_account".
Step 2: Check if some data shows but not all
- If subscription metrics show data but traffic metrics are zero:
- Subscription data comes from the platform database (works without GA4).
- Traffic data requires GA4. Check Step 1.
- If traffic data shows but paywall funnel is empty:
- The Reader Portal may not be firing paywall tracking events. Ask your technical team to verify.
Step 3: Check your permissions
- If you see a lock icon and "Access Restricted" message, you do not have the Analytics Read permission.
- Contact your administrator to get the appropriate role.
Step 4: Check the date range
- Make sure the date range is set to a period that has data.
- If you just launched the platform, try 7d first.
- If the platform is new, it takes 24-48 hours for GA4 data to start appearing.
Step 5: Check if the Reader Portal is live
- If the Reader Portal is not deployed or not receiving traffic, GA4 will have no data to report.
- Try visiting the Reader Portal yourself and then check GA4 directly (using the "Open Google Analytics" link at the bottom of the Analytics page).
Example 6: Finding the Best Time to Post on Social Media
Scenario: The social media team wants to optimize their posting schedule.
Steps:
- Go to Social > Analytics.
- Set the period to 90 days for a reliable sample.
- Click the Performance tab if not already selected.
- Scroll down to the Best Times Heatmap.
- The heatmap shows a grid: days of the week (rows) by hours of the day (columns).
- Darker cells indicate higher engagement rates at that time.
- Identify the 3-5 darkest cells — these are your optimal posting windows.
- Also check the Content Type Breakdown table to see which content types (Image, Video, Link Share, etc.) perform best.
- Combine insights: Post your best content type during your best time slots.
Example 7: Understanding Where Your Readers Come From
Scenario: The marketing team wants to understand traffic attribution to allocate budget.
Steps:
- Go to Analytics in the sidebar.
- Set the date range to 30d.
- Look at the Traffic Sources card:
- If Organic Search is dominant (>40%), your SEO strategy is working well.
- If Direct is high, you have strong brand recognition (people type your URL).
- If Social is growing, your social media efforts are driving traffic.
- If Email is significant, your newsletter campaigns are effective.
- If Paid is low despite active ad campaigns, check your UTM parameter setup.
- Scroll down to Top Countries to see geographic distribution.
- Check Device Breakdown to understand if your audience is mostly mobile or desktop.
- Export the data for a marketing budget review meeting.
Example 8: Reviewing Social Media ROI Across Platforms
Scenario: Leadership wants to know which social platform delivers the best return on effort.
Steps:
- Go to Social > Analytics.
- Set the period to 30 days.
- On the Performance tab, find the Platform Comparison card.
- Compare across platforms:
- Which platform has the highest Engagement Rate?
- Which drives the most Impressions and Reach?
- Switch to the Attribution tab.
- Check the Platform Traffic Breakdown — which platform sends the most clicks to your website?
- If you have Executive access, switch to the Executive tab for KPI goal tracking.
- Export the report to share with leadership.
13. Common Mistakes and How to Fix Them
| Mistake | What Happens | How to Fix |
|---|---|---|
| GA4 not configured | Traffic metrics, content performance, device breakdown, and geographic data all show zero or placeholder values | Go to Settings > Integrations, click Configure on the GA4 card, and enter valid Measurement ID, Property ID, and Service Account Key |
| Wrong Measurement ID format | GA4 connection fails silently | Ensure the ID starts with G- followed by at least 10 characters (e.g., G-ABC1234567) |
| Wrong Property ID format | GA4 data queries fail | Ensure the Property ID is a number with 9 or more digits |
| Invalid Service Account Key | GA4 API authentication fails, no traffic data loads | Paste the complete JSON key file contents. It should start with {"type": "service_account" |
| Reader Portal cookie consent not accepted | No GA4 events fire for that visitor | This is expected — analytics only tracks visitors who consent. Inform your team that analytics coverage depends on consent rates |
| Looking at too narrow a date range | Charts look empty or have very few data points | Try a wider date range (30d or 90d) for more meaningful trends |
| Confusing Page Views with Unique Visitors | Overestimating audience size | Page Views counts every page load; Unique Visitors counts distinct people. A small audience can generate many page views |
| Expecting real-time data | Data appears stale or zero for very recent activity | GA4 data can take 24-48 hours to fully process. The Dashboard page uses more recent platform data |
| Not having Export permission | Export button is not visible | Contact your administrator to add the Analytics Export permission to your role |
| Social analytics empty | No social posts or accounts connected | Connect at least one social account in Settings > Integrations > Social Media and publish posts |
| Comparing periods of different lengths | Trends look misleading | When using Custom date ranges, make sure you compare periods of equal length for fair comparison |
Use this checklist to verify that the Analytics & Reporting module is functioning correctly.
- User with Analytics Read permission can access the Analytics page
- User without Analytics Read permission sees the "Access Restricted" lock screen
- User with Analytics Export permission sees the Export button
- User without Analytics Export permission does not see the Export button
- User with Social Analytics Read permission can access Social Analytics
- User with Social Executive Read permission can see the Executive tab
- Page loads without errors
- Loading skeleton animation shows while data loads
- All 4 metric cards display values (Page Views, Unique Visitors, Sessions, Avg. Session Duration)
- Metric cards show comparison arrows and percentages
- Bounce rate displays as subtitle on the Session Duration card
- Traffic Chart renders with at least one line visible
- Traffic Chart metric toggles (Page Views, Unique Visitors, Sessions) work
- Hovering over chart data points shows tooltips with values and dates
- Traffic Sources card shows percentage bars for all 6 sources
- Subscription Metrics card shows Total Subscribers, New Subscribers, Churn Rate, MRR
- Subscription by Plan breakdown shows plan names and percentages
- Subscriber trend sparkline renders
- Conversion Rate, ARPU, and LTV display at the bottom of subscription card
- Top Content table lists articles with rank, title, page views, time on page, shares, comments
- Clicking an article in Top Content navigates to the content detail page
- Device Breakdown shows Desktop, Mobile, and Tablet percentages
- Top Countries shows up to 5 countries with flags and percentages
- "Open Google Analytics" link opens in a new tab
- Default selection is 30 days
- Clicking 7d updates all data to last 7 days
- Clicking 30d updates all data to last 30 days
- Clicking 90d updates all data to last 90 days
- Clicking 12m updates all data to last 12 months
- Custom date range accepts start and end dates and updates data
- Changing the date range causes all charts and metrics to reload
- Clicking Export downloads a CSV file
- CSV filename includes the date
- CSV contains traffic source data (if GA4 configured)
- CSV contains subscription data
- Opening the CSV in a spreadsheet application works without formatting errors
- Welcome message shows the logged-in user's first name
- All 4 primary stat cards show values
- Content & Moderation status cards show counts
- Clickable cards navigate to correct pages (Content filtered by status, Moderation)
- Most Popular section lists articles with views and comments
- Under Review section shows pending articles
- Quick Actions links work (New Article, Moderation, Analytics)
- Social Overview shows scheduled today, this week, and failed counts
- Failed posts alert appears when count > 0 and links to failed posts
- Recently Published shows up to 6 articles with engagement metrics
- Performance tab loads with metric cards and charts
- Platform Comparison shows data for connected platforms
- Follower Growth Chart renders with account-specific lines
- Best Times Heatmap displays 7x24 grid with color intensity
- Top Posts Table shows posts ranked by engagement
- Attribution tab shows funnel and platform breakdown
- Executive tab is only visible to users with the correct permission
- Period selector (7, 14, 30, 90 days) updates all data
- Export button downloads data
- Analytics page works when GA4 is not configured (shows empty/placeholder data, not errors)
- Analytics page works when there are no subscribers (subscription metrics show zero)
- Analytics page works when there are no articles (top content shows empty state)
- Social Analytics works when no social accounts are connected (shows empty state with CTA)
- Refresh button reloads data without page navigation
- Page handles API errors gracefully (no crash, shows error state)
| Limitation | Impact | Workaround |
|---|---|---|
| GA4 data can take 24-48 hours to process | Very recent activity may not appear in analytics immediately | Use the Dashboard for more real-time platform metrics (articles, subscribers); check GA4 directly for real-time visitor data using the "Open Google Analytics" link |
| Traffic data requires GA4 | Without GA4 configured, traffic, content performance, device, and geographic data will be unavailable | Configure GA4 in Settings > Integrations. Subscription and article data will still work without GA4 |
| Cookie consent affects data completeness | Visitors who decline cookies will not be tracked in GA4, potentially underreporting traffic | This is expected behavior for privacy compliance. Consider the consent acceptance rate when interpreting traffic numbers |
| Institutional usage reports are API-based | There is no dedicated admin UI page for browsing institutional usage — data is accessed via the API | Contact your technical team or administrator for institutional usage reports; the data is available programmatically |
| PDF export not yet available | Export currently supports CSV and JSON only | Export as CSV and use a spreadsheet application to format and print/PDF as needed |
| No saved/scheduled reports | You cannot schedule automatic report delivery via email | Manually export data as needed. Scheduled reports may be added in a future release |
| Social analytics requires connected accounts | Social analytics pages will show empty states without connected social accounts | Connect accounts via Settings > Integrations > Social Media before using Social Analytics |
| Paywall funnel depends on Reader Portal events | If the Reader Portal is not properly firing paywall tracking events, the funnel will be incomplete | Have your technical team verify that paywall events are firing correctly in the Reader Portal |
| Author Stats are API-only | Per-author content performance data is available via the API (/api/analytics/author-stats) but not yet displayed on a dedicated admin page | Access author performance data via API export or build a custom report |
| Registration Funnel is API-only | The registration funnel (Visitors → Registered → Subscribed) is available via the API (/api/analytics/registration-funnel) but not yet displayed on the Analytics page | Access registration funnel data via API or export |
This user manual covers the Analytics & Reporting module as implemented in the Hyphen Admin Console as of March 2026. Core analytics features including the Paywall Conversion Funnel and Content Engagement (scroll depth) are fully implemented and displayed on the Analytics Overview page. Author Stats and Registration Funnel APIs are available for programmatic access. For technical implementation details, refer to the architecture documentation and API docs.